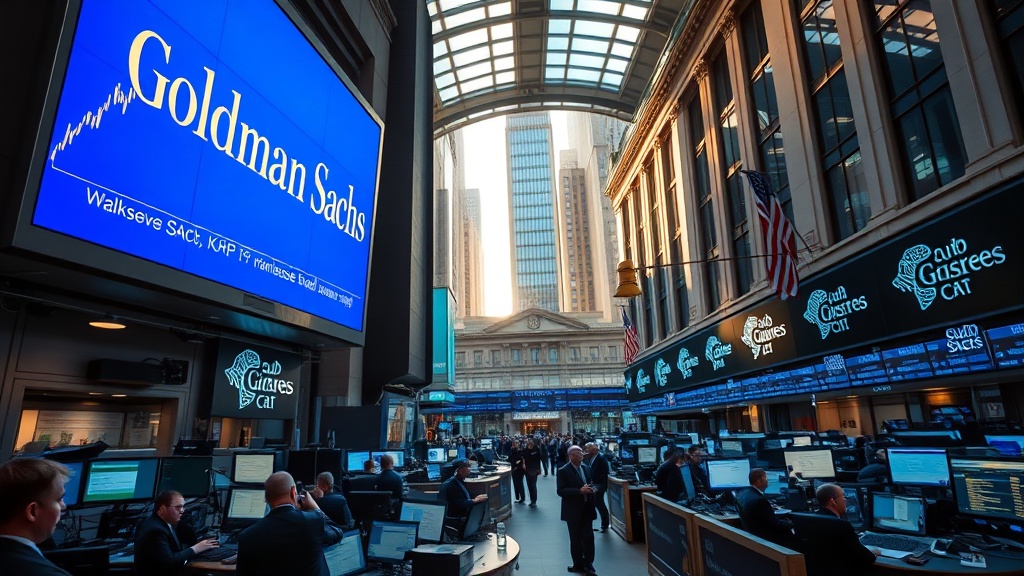
Goldman Sachs Beats Earnings – Financials Rally and Trade Setup

Goldman Sachs just blew past Wall Street expectations, and the ripple effect is reshaping the financial sector. If you’re looking for a clear, actionable trade that aligns with today’s market dynamics, keep reading.
What Did Goldman Sachs Report?
In its March 9 earnings release, Goldman posted earnings per share (EPS) of $14.01 versus the consensus estimate of $11.62, a 21% beat (source: Reuters). Revenue jumped 12% YoY, driven by a surge in investment‑banking fees and record‑high trading volumes.
How Did the Market React?
The immediate reaction was a 3.2% pop in GS stock and a broader lift in financials. The S&P 500 Financials Index (+SP500F) climbed 2.1% on the day, outpacing the broader S&P 500, which was flat. Even defensive banks like JPMorgan and Bank of America posted modest gains.
That move wasn’t just a one‑off bounce; it signaled a sector rotation from tech‑heavy growth stocks back into the “real economy” — a theme we’ve been tracking since the AI‑spending hangover earlier this year.
Why Is This Fueling a Financial Sector Rotation?
Three forces are converging:
- Capital reallocation: After months of AI‑driven hype, investors are chasing tangible earnings. Goldman’s beat proves that traditional banking and capital‑raising services still generate robust cash flow.
- Policy tailwinds: The OPEC+ meeting on March 1 left oil prices hovering near $95/barrel, supporting the broader economy and giving banks more confidence to lend.
- Risk‑on sentiment: With the Fed’s policy rate steady at 3.5‑3.75%, cost of capital is affordable again, making balance‑sheet‑heavy financials attractive.
What Trade Setup Can You Use Today?
Here’s a concrete, risk‑controlled play you can execute right now:
- Long the Financials ETF (XLF) — It offers diversified exposure to the sector and captured a 2% gain on the earnings day.
- Set a tight stop‑loss: Place it 2% below the entry price. For a $74 entry, that’s $72.52. This caps downside while still giving the trade room to breathe.
- Target a 4‑5% upside: Aim for $77‑$78. That aligns with the sector’s recent momentum and the next support level on the 200‑day moving average.
- Size appropriately: Risk no more than 1‑2% of your total capital on this trade. If your account is $10,000, that’s a $100‑$200 risk.
Why XLF? It avoids the single‑stock risk of betting on GS alone, yet it benefits from the same earnings‑driven optimism sweeping the sector.
How to Manage Risk on This Trade?
Risk management is the difference between blowing up an account and building wealth. Follow these steps:
- Position sizing: Use the position‑sizing framework we’ve outlined in our risk‑management guide.
- Monitor macro catalysts: Keep an eye on the upcoming CPI report (Wednesday) and any fresh OPEC+ statements. A surprise on either side could shift sentiment quickly.
- Adjust stops on the move: If XLF climbs 2% above entry, trail the stop to breakeven. This protects gains without choking the trade.
Takeaway – Your Action Plan
Goldman’s earnings beat is more than a headline; it’s a catalyst for a broader financials rotation. By taking a disciplined, sized position in XLF with a clear stop and target, you can capture the upside while keeping risk in check. Review your risk parameters, place the trade, and stay glued to the macro calendar – especially the CPI release later this week.
Related Reading
- From Silicon to Steel: The Sector Rotation Most Retail Traders Are Missing — Deep dive on why capital is flowing out of mega‑cap tech.
- Markets Get Hammered: SPY Drops 2% on Iran Fears — A reminder that geopolitical risk can swing sentiment fast.
- The Only Thing That Keeps You Trading: Position Sizing and Risk Management That Actually Works — Our go‑to guide for sizing any trade.